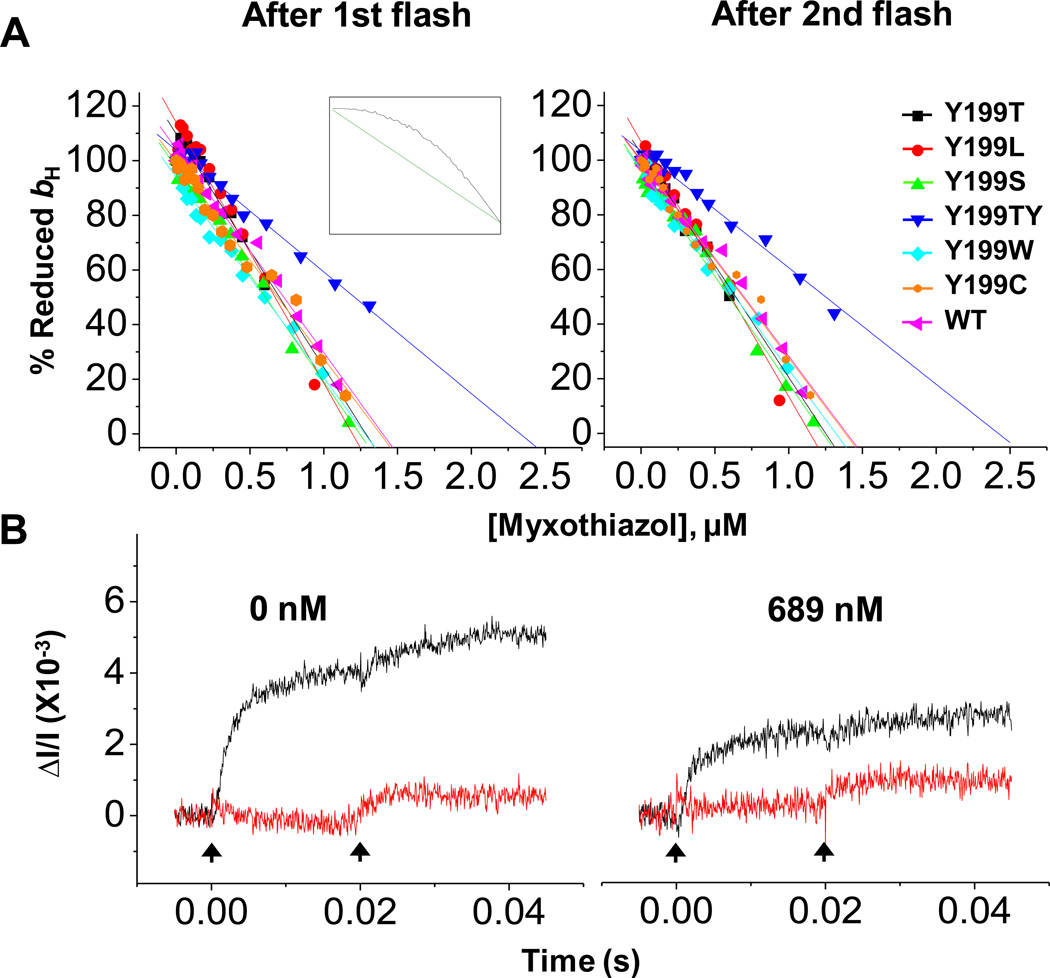
Fig. 2. Titrations of Qo-site with myxothiazol.
(A) Fraction (% of change with no inhibitor) of reduced bH at 20 ms (after 1st flash) and 50 ms (after 2nd flash) versus inhibitor concentration. Chromatophores from native and mutant strains of R. sphaeroides were poised at Eh 100 ±10 mV at pH 7.0 and 20 °C. Rates were measured in the presence of antimycin to block oxidation of heme bH through the Qi-site, as Qo-sites were titrated with myxothiazol. Insert shows titration curves expected without (straight line, green) or with (convex curve, black) inter-monomer electron transfer, from simulation (see [26]). (B) Kinetics of reduction of heme bH (black) and heme bL (red) in wild-type following two flashes. Myxothiazol was added at the concentrations shown. The vertical arrows indicate flash activation. The pattern is diagnostic of monomeric function.

