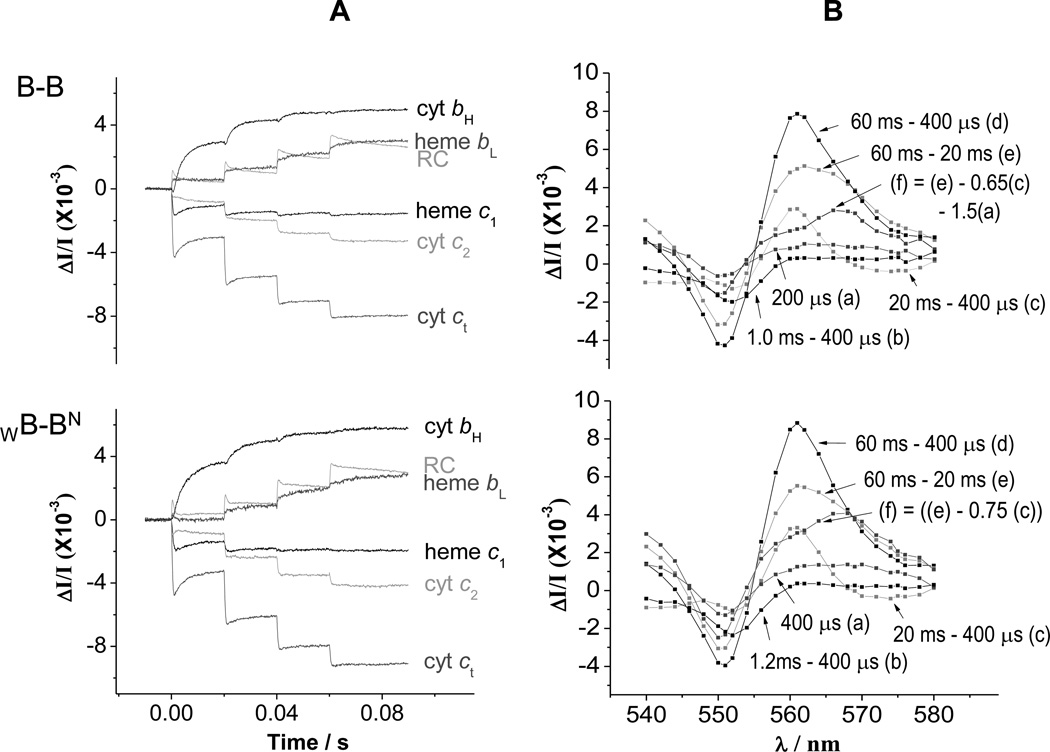
Fig. 3. Kinetics in strains containing heterodimeric constructs.
(A) Kinetic traces for the components of the photosynthetic chain, measured from difference kinetics at the following wavelengths. Reaction center (RC); 542 nm; cyt ct, 551-542 nm; cyt c2, 550–554 nm; heme c1, 552-548 nm; heme bH, 561–569 nm; heme bL, (566–575 nm) – 0.5(heme bH) (with additional small corrections for c-type hemes and RC. (B) Spectra at selected times showing involvement of hemes bH, bL, c1, c2, and RC. (a) Change 400 µs after first flash shows mainly cyt c2 oxidation; (b) over the period 0.4–1.2 ms, heme c1 oxidation dominates the change; (c) from 0.4 to 20 ms, heme bH reduction dominates the kinetics, with a derivative spectrum in the range 548–554 nm showing electron transfer from heme c1 to cyt c2; (d) the changes after the second and subsequent flashes contain contributions from all centers; (e) after the second flash, heme bL and most of the remaining heme bH go reduced; (f) subtraction of a fraction of the change (c) reveals the spectrum of heme bL reduction. RC changes contribute through a rather flat spectrum across this wavelength span, but dominate at 542 nm, where the heme changes are approximately isosbestic. Times given are after flash 1 at 0 s. Flashes are spaced 20 ms apart. Chromatophores from B-B and WB-BN cells were poised at Eh ~120 mV by addition of 2 mM ascorbate, with 2 mM KCN added to inhibit cyt oxidase activity.

