
Figure 6.
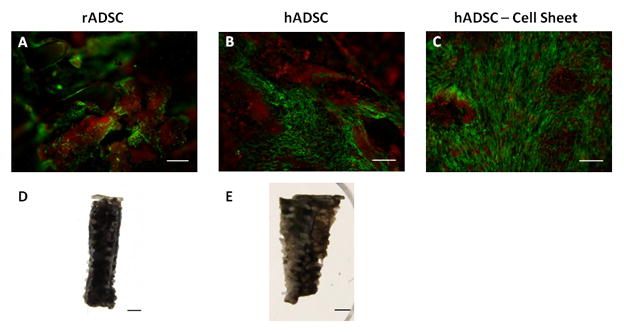
Histological differences in the mineralized matrix of rADSCs and hADSCs: fluorescence imaging of rADSC (A) and hADSCs (B & C) after12 weeks of culture in osteogenic media (scale bar = .5 mm; green = cells, red = mineral). Von Kossa staining of rADSC (D) and hADSC (E) cell seeded constructs after 12 weeks of culture in osteogenic media (scale bar = 1 mm).