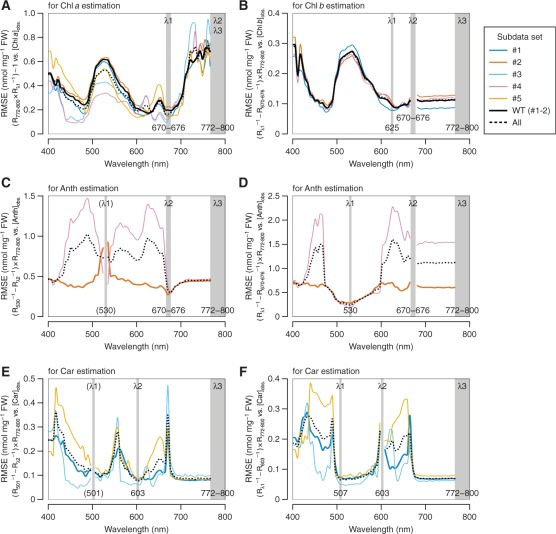
Fig. 4.
Optimization of wavebands λ1 and λ2 in the model (Rλ1−1 – Rλ2−1)×Rλ3 for the estimation of individual pigment concentrations. The analysis was performed on the calibration data set. Details of each subdata set (#1–5) are summarized in Table 1. The process of model tuning for Chl a (A), Chl b (B) and Anth (C and D) estimation, or Car estimation in the absence of Anth accumulation (E and F) is indicated. The RMSE was calculated for linear regression of the model indicated in the vertical label vs. the observed concentration of the pigment of interest. A lower RMSE indicates more accurate estimation. In C and E, λ1 is indicated in parentheses due to its temporary nature; the optimal waveband was reconsidered in the second step of model tuning in D and F, respectively. WT, wild type.

