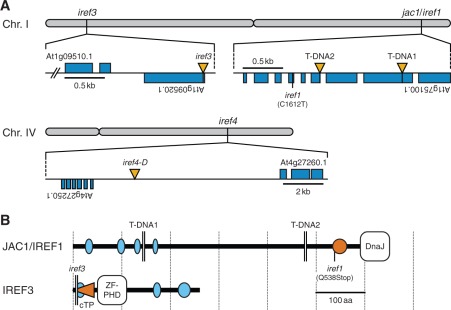
Fig. 8.
Identification of irregular reflectance (iref) loci. (A) Chromosomal positions of iref mutations. Rectangles (blue) and vertical triangles (yellow) indicate exons and T-DNA insertions, respectively. The iref1 mutation causes a C-to-T transition at nucleotide 1,612 (excluding introns) in an ORF At1g75100.1. T-DNA1 and 2 indicate T-DNA positions in WiscDsLox457-460P9 and SAIL_574_B09 lines, respectively. The iref3 genome contains a T-DNA 20 bp downstream from the translation start site of an ORF At1g09520.1. The iref4-D mutation is linked to a T-DNA located within an intergenic region between ORFs At4g27250.1 and At4g27260.1 (2.1 and 7.1 kb apart, respectively). (B) The structure of JAC1/IREF1 and IREF3 proteins. The diagram is based on the information available from the InterPro (http://www.ebi.ac.uk/interpro/) and SMART (http://smart.embl.de/) database, and a TargetP prediction (http://www.cbs.dtu.dk/services/TargetP/). Ellipses indicate segments of low compositional complexity (light blue) and a coiled-coil region (orange). The horizontal triangle (orange) in IREF3 indicates the putative chloroplast transit peptide (cTP). The iref1 mutation truncates the C-terminal 114 amino acids (aa) of the JAC1/IREF1 protein (651 aa). T-DNA1 and 2 truncate the protein at aa 145 and 478, respectively. The iref3 T-DNA truncates the IREF3 protein (260 aa) at aa six. DnaJ, DnaJ molecular chaperone homology domain; ZF-PHD, zinc finger plant homeodomain-type signature.

