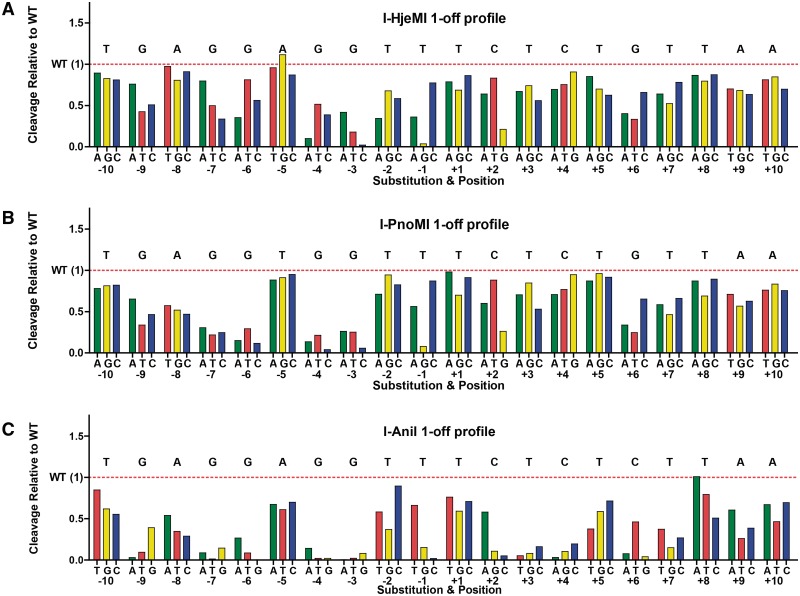
Figure 3.
Specificity profiles for (A) I-HjeMI, (B) I-PnoMI and (C) I-AniI. The impact of each possible single-base pair substitution is shown relative to wild-type cleavage efficiency (red dashed line, wild-type base noted above). Values at or close to zero denote minimal tolerance of the mismatch and therefore minimal cleavage, while values above one indicate a target is cleaved more efficiently than the predicted target.

