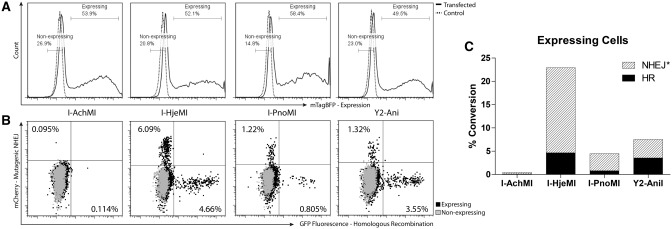
Figure 4.
LHE functionality in vivo. (A) Nuclease-expression histogram. Number of cells (Y-axis) of a given mTagBFP fluorescence (X-axis) are shown to be uniform for all transfected cells (solid line) and are compared with an untransfected control (dashed line). Gates used for comparison of expressing and non-expressing populations in panel (B) are shown. (B) Mutagenic NHEJ and HR repair events are shown for each nuclease-expressing population (black) compared with the non-expressing (gray). NHEJ events are mCherry(+) (Y-axis) and HR events are GFP(+) (X-axis). (C) As each mCherry(+) cell represents approximately one-third of the actual mutagenic NHEJ events (18) (Supplementary Figure S1d), a corrected value is plotted for NHEJ events, calculated by multiplying the number of mCherry(+) cells by three. Cells with converted loci, by event type, are shown as a percentage of the total expressing population.

