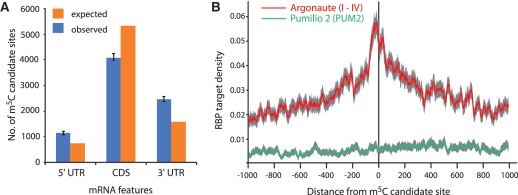
Figure 5.
Analysis of bias in m5C candidate site location within mRNA. (A) Histogram showing relative enrichment of m5C sites in 3′ UTR and 5′ UTR compared to CDS (Error bars = 95% confidence interval; ‘Poisson’ distribution). (B) RNA-binding protein target density versus distance from m5C site in protein coding transcripts (CDS and UTR both). Confidence bands are shown in grey (SEM).

