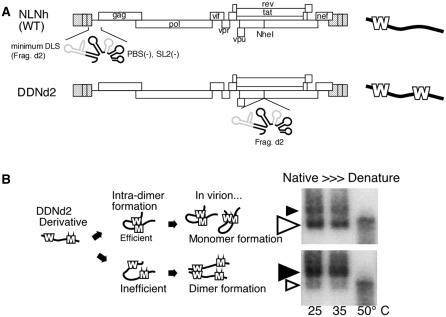
Figure 1.
System utilized to map the functional sequence of HIV-1 DLS. (A) Schematic representation of the constructs utilized. On the right, bold lines represent viral genomes. Ws represent DLS at native and ectopic positions. Ectopically inserted DLS (d2 fragment) expands from nucleotide 557 to nucleotide 806 (NL4-3 DNA sequence, Genbank Accession no. M19921.2) with deletions of partial PBS stem–loop and SL2. (B) Schematic of the genome dimerization assay. Bold lines represent viral genomes. Ms represent d2 fragments with mutations. Native northern blots of viral RNA of DDNd2 derivatives are shown on the right. Black and white arrowheads indicate the dimeric and monomeric viral genome, respectively. Where the size of the arrowheads indicate the relative strength of the signal. The temperatures of RNA incubation are shown.

