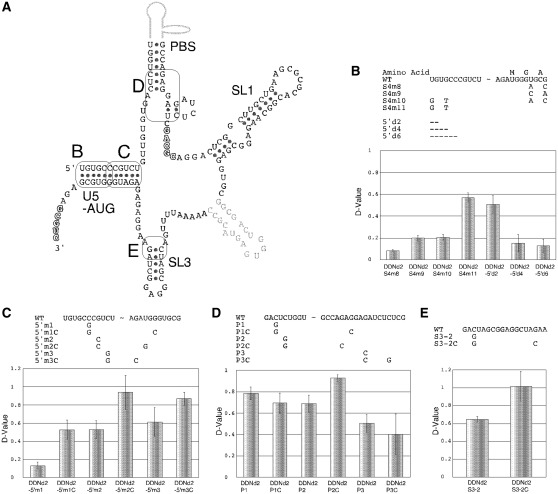
Figure 4.
Confirmation of the stem formations within the DLS. (A) Schematic representations of the stems in HIV-1 DLS studied in this report. The specific positions examined are enclosed with rectangles and tagged with capitals. (B–E) The dimerization assay of the mutants. Upper tables describe the mutations introduced. Hyphens represent base deletions. Lower graphs represent dimerization ability of the mutants. Results are the average of at least three independent experiments with SEM.

