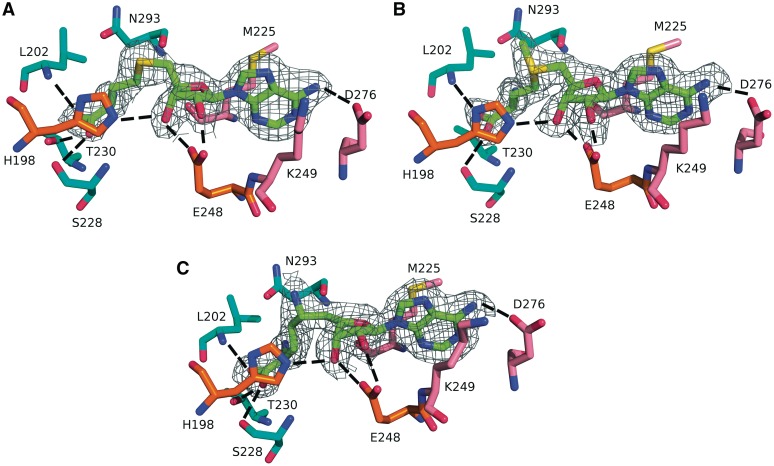
Figure 3.
Active site of PfTrm14 bound to (A) SAH, (B) SAM and (C) SFG. The 2Fo − Fc omit density map is shown for the ligands. The map is contoured at 2 σ within 1.6 Å of the ligand. The ligands are shown with their C atoms colored green, the amino acid residues are shown with their C atoms colored pink (interacting with adenine), orange (interacting with ribose) or cyan (interacting with the homocysteine part). Hydrogen bonds are indicated by dashed lines.

