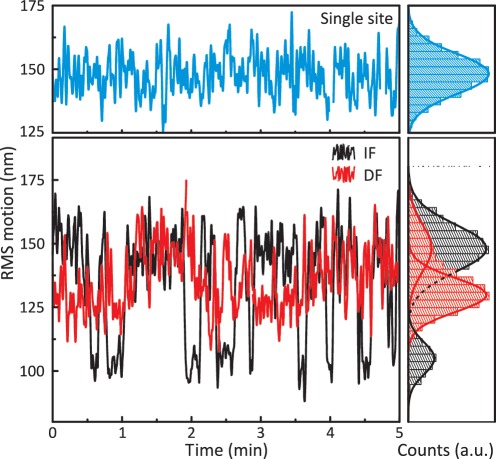
Figure 5.
TPM experiments. Upper panel: the RMS motion for an individual bead tethered by a DNA containing one FokI site, in the presence of 5 nM FokI in CC-buffer, is plotted as a function of time (blue trace). Lower panel: as above except that the DNA contained two FokI sites 190 bp apart in either inverted (IF: black trace) or directly repeated (DF: red trace) orientation. In all three cases, the distribution of the RMS values is plotted as a histogram in the right-hand panels, in corresponding colours. The histogram for the single-site DNA was fitted to a single Gaussian and those for the two-site constructs to double Gaussians.

