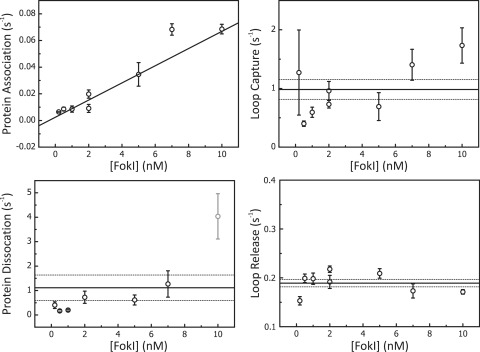
Figure 3.
Concentration dependence of kinetic rates determined by TPM. Protein association, dissociation, loop capture and loop release rates were determined at various concentrations of FokI (0.2, 0.5, 1, 2, 5, 7 and 10 nM) on a DNA construct containing two FokI sites in inverted orientation separated by 190 bp (IF190). Each data point represents the average value from at least 25 DNA molecules. Error bars on the data points denote the SEM. The graphs, apart from that for protein association, show the average rate across the range of FokI concentrations (solid black line) and the SEs (the dotted lines above and below the averages). Rates calculated for protein dissociation (1.1 ± 0.5 s−1), loop capture (1.0 ± 0.2 s−1) and loop release (0.19 ± 0.01 s−1) all showed no systematic variation with the enzyme concentration. In contrast, rates calculated for protein association varied linearly with FokI concentrations to yield from the slope a second order rate constant (6 ± 1 × 10⁶ M−1 s−1). Above 8 nM FokI, DNA looping between non-specific sequences, i.e. DNA condensation, was sometimes observed, making it hard to extract certain rates (namely the grey data point for the protein dissociation rate).

