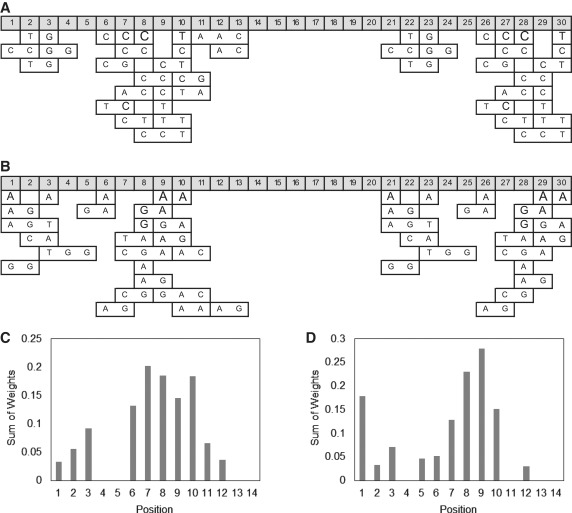
Figure 10.
Graphical representation of significant position motifs identified via Naïve Bayes machine learning. The 25 highest-ranking position motifs of (A) well-performing Class I templates and (B) poorly performing Class II templates. The font size for significant motifs shown in A and B is correlated to each motif’s relative weight, i.e. relative importance. Sum of weights calculated for each variable position using the top 25 motifs identified by RELIEF attribute evaluation within (C) well-performing Class I templates and (D) poorly performing Class II templates.

