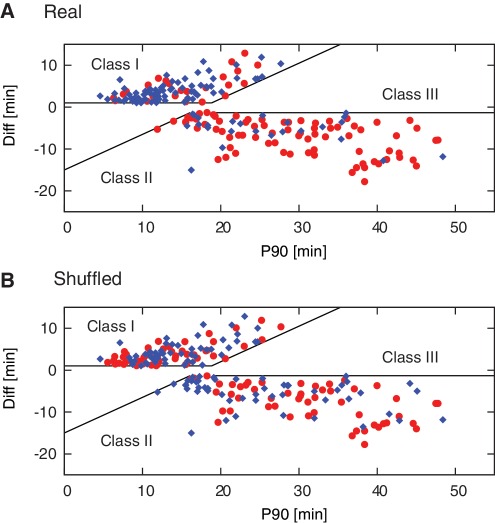
Figure 8.
EXPAR template performance predicted using the Naïve Bayes machine learning approach. Plot of experimentally determined P90 versus Diff values for Class I and Class II templates, with color coding to indicate the predicted classification into Class I templates (good performers, blue diamond), and Class II templates (poor performers, red circles) for all test-set sequences after 10 iterations based on (A) real data, and (B) shuffled data.

