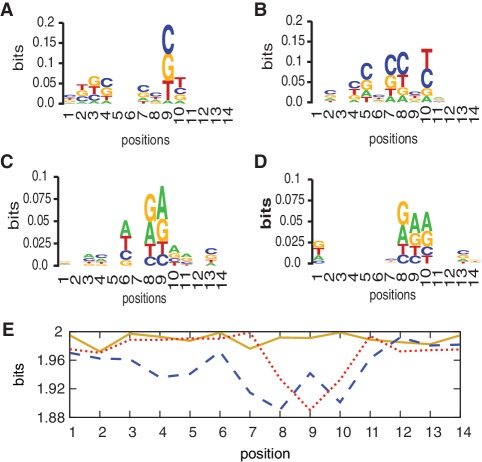
Figure 9.
Position-dependent nucleotide frequency maps (sequence logos) (A) low P90 (fast amplification) (B) large positive Diff (good temporal separation between specific and non-specific amplification) (C) high P90 (slow amplification), and (D) large negative Diff (poor temporal separation between specific and non-specific amplification). A–D were generated by an online graphical sequence representation tool (54,55) using the template sequences which were used to generate PWM. At each position, the size of the overall stack indicates the conservation of that position, while the size of each symbol represents the frequency of that nucleic acid at that position. (E) Shannon entropy (56) for each variable position in Class I templates (blue dashed line), Class II templates (red dotted line) and Class I and Class II combined (orange solid line).

