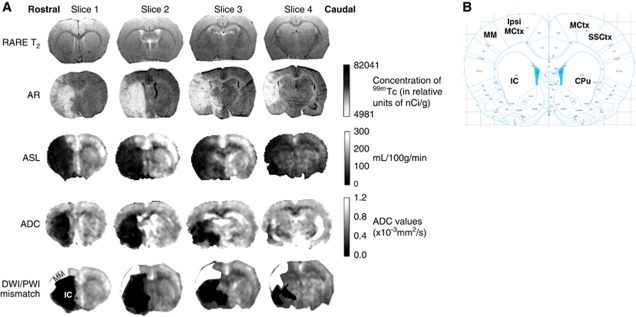
Figure 1.
(A) Representative rat coronal slices spanning MCA territory (rostrocaudally) showing, RARE T2, 99mTc HMPAO autoradiography, ASL, ADC (from DWI), and DWI/PWI mismatch (MM) images. Using neuroanatomical landmarks, RARE T2 images (rostrocaudal distance ∼2 mm anterior to 4.0 mm posterior to bregma) were used to select autoradiography sections that spatially matched ASL images. ADC maps generated from DWI show the ischemic lesion (in black). The ADC lesion is superimposed on top of the perfusion deficit identified from the ASL scan to reveal the DWI/PWI MM (white) and ischemic caudate nucleus (IC) (black) ROIs on MRI images. (B) Illustration from the rat stereotaxic atlas (Paxinos and Watson, 2007) at the level of slice 1 (2 mm anterior to bregma) showing six ROIs where cerebral blood flow (CBF) was measured by MRI and autoradiography: contralateral motor cortex (MCtx); sensorimotor cortex (SSCtx); caudate putamen (CPu); ipsilateral motor cortex (ipsi MCtx); DWI/PWI MM; and IC. ADC, apparent diffusion coefficient; ASL, arterial spin labelling; AR, autoradiography; DWI, diffusion-weighted imaging; MCA, middle cerebral artery; MRI, magnetic resonance imaging; PWI, perfusion-weighted imaging; RARE, Rapid Acquisition with Relaxation Enhancement; ROIs, regions of interest.

