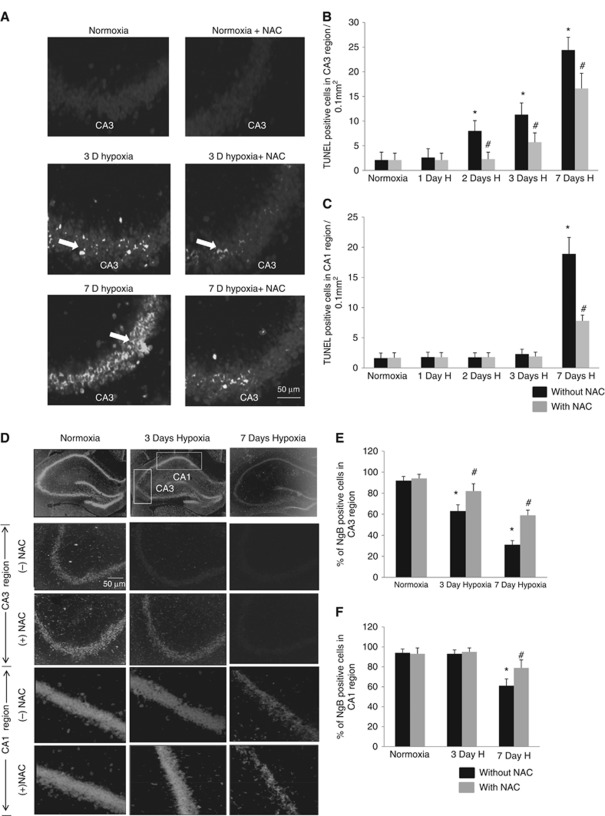
Figure 1.
Hypobaric hypoxia induced neurodegeneration in CA1 and CA3 regions of the hippocampus. (A) Representative images of terminal deoxynucleotidyl transferase-mediated dUTP nick-end labeling (TUNEL)-positive cells in the CA3 region of the hippocampus. Graphs denote mean±s.e.m. of number of TUNEL-positive cells in random fields of 0.1 mm2 in each group (n=6) of (B) CA3 region (C) CA1 region. *Denotes P<0.01 when compared with normoxic group and # denotes P<0.01 when compared with corresponding N-acetyl-cysteine (NAC)-untreated group. (D) Representative images of the neuroglobin (Ngb)-positive cells in random fields of 0.1 mm2 in the CA1 and CA3 regions of hippocampus. Graph depicting mean±s.e.m. of percentage of Ngb-positive cells in (E) CA3 and (F) CA1 regions of the hippocampus. *Denotes P<0.01 when compared with normoxic group and # denotes P<0.01 when compared with corresponding NAC-untreated group.

