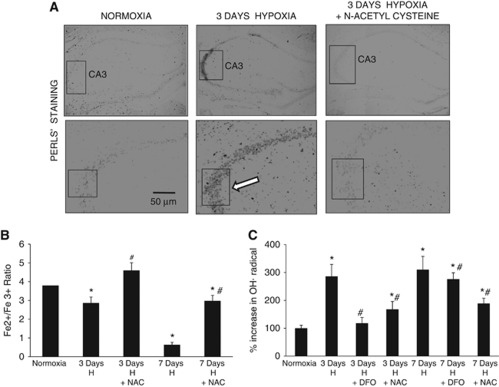
Figure 2.
Hypoxia results in Fe3+ deposition and hydroxyl radical generation. (A) Representative images of Perl's staining in the CA1 and CA3 regions of hippocampus. Scale bars shown in μm. (B) Graph showing Fe2+/Fe3+ ratio in hippocampal samples as estimated biochemically. The concentration of Fe2+/Fe3+ was determined from a standard curve. (C) Graph depicting concentration of hydroxyl radical as determined by high-performance liquid chromatography. Concentration of reactive oxygen species (ROS) was determined indirectly by calculating the area of plot for the ROS metabolite 2,3-DHBA. *Denotes P<0.01 when compared with normoxia and # denotes P<0.01 when compared with corresponding NAC-untreated group. H, hypoxia; NAC, N-acetyl cysteine; DFO, desferrioxamine; DHBA, dihydrobenzoic acid.

