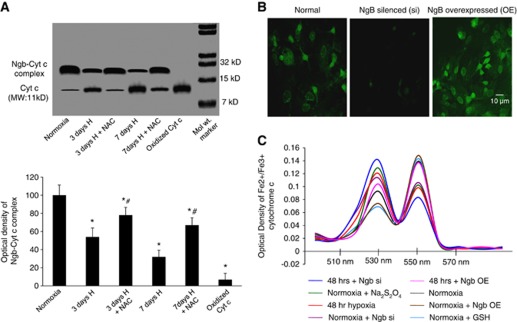
Figure 4.
Hypoxia reduces Ngb–Cyt c interaction. (A) Western blot depicting Ngb–Cyt c interaction using monoclonal antibodies for Cyt c. Oxidized Ngb and oxidized Cyt c obtained from normoxic samples treated with H2O2 were loaded as negative control. The corresponding graph depicts optical density of the protein bands in terms of percentage of protein expression assuming normoxic values without drug treatment to be 100%. *Denotes P<0.01 when compared with normoxia and # denotes P<0.01 when compared with corresponding NAC-untreated group. (B) Representative images of normal, Ngb-silenced, and Ngb upregulated N2a cells. (C) Graph denotes mean value of six observations of absorbance at 530 nm for oxidized Cyt c and 550 nm for reduced Cyt c concentration. In all, 1 mM GSH or 7 mM Na2S2O4 was added to maintain Cyt c in the reduced or oxidized state, respectively. Cyt c, cytochrome c; H, hypoxia; NAC, N-acetyl cysteine; Ngb, neuroglobin; Si, silenced; OE, overexpressed.

