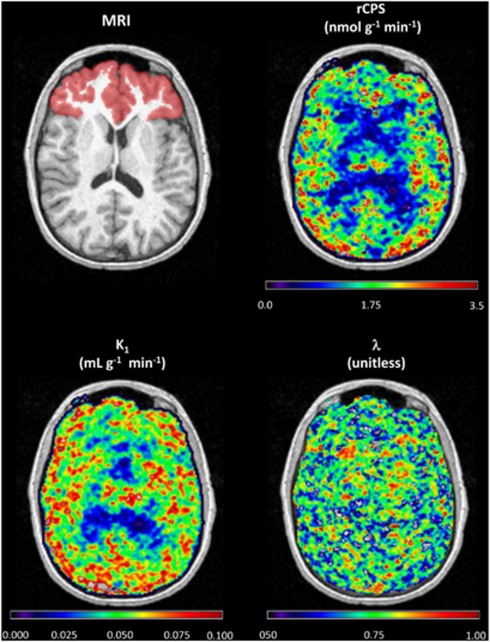
Figure 2.
Magnetic resonance imaging (MRI) and parametric maps of regional rate of cerebral protein synthesis (rCPS), λ, and K1 obtained with voxel-spectral analysis with iterative filter (SAIF). Images are of a representative transaxial slice for one subject. Red area in the MRI image represents the frontal cortex region for the particular slice. A Gaussian filter (full width at half maximum (FWHM) 1.7 mm) was employed to smooth each of the parametric images in three dimensions before visualization.

