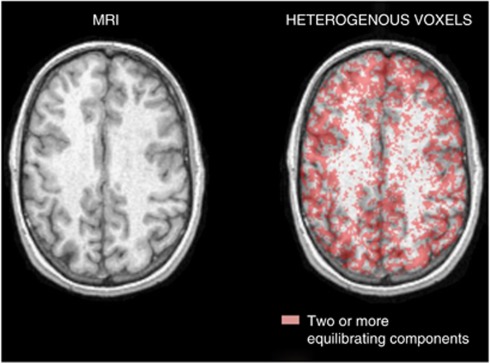
Figure 5.
Magnetic resonance imaging (MRI) and spatial distribution of heterogeneous voxels. T1-weighted MR image (left) and the same image fused with the spatial distribution of voxels estimated to be heterogeneous (right). The red area corresponds to those voxels in which voxel-spectral analysis with iterative filter (SAIF) detects two or more equilibrating components.

