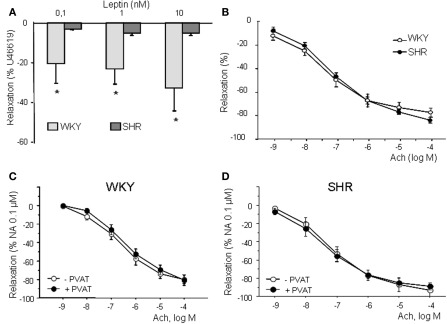
Figure 4.
Concentration-response curve to leptin (10−10 to 10−8 M) (A) and acetylcholine (10−9 to 10−4 M) (B) in aortic rings from WKY and SHR. Concentration-response curve to Ach in aortic rings from WKY (C) and SHR (D) in presence and absence of PVAT. Relaxation is expressed as percentage of a previous contraction to U46619 (10−7 M). Data are shown as mean ± SEM of 10 animals per strain.

