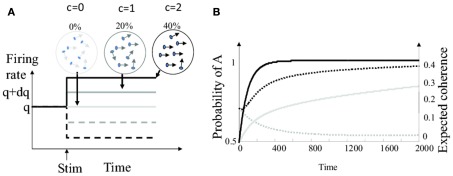
Figure 2.
Bayesian decision making with varying levels of motion coherence. (A) Firing rate of the model sensory neuron in response to motion stimuli (start of stimulation marked by upward pointing arrow) for different levels of coherence. Plain lines: stimulus is in the preferred direction. Dashed lines: stimulus is in the anti-preferred direction. The gray scale indicates the strength of motion coherence. (B) Outcome of the “full” Bayesian integrator computing the joint probabilities of all pairs of choices and coherences. Time 0 correspond to the start of the trial. Plain black line: probability of choice A for coherence c = 0.2 (averaged over 20000 trials were A was the correct choice). Plain gray line: probability of choice A for coherence c = 0.05. Dotted black line: expected value for motion coherence ĉ for true coherence c = 0.2. Dotted gray line: expected value for motion coherence ĉ for true coherence c = 0.05.

