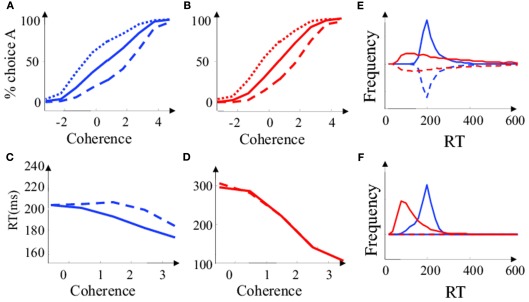
Figure 4.
Simplified Bayesian and “diffusion” decision model in the “reaction time” task. (A) Proportion of choice A as a function of motion coherence for the simplified Bayesian model. Positive coherence corresponds to stimuli moving in direction (A), negative coherence to stimuli moving in the opposite direction. Plain Lines: the two choices are a priori equiprobable (Lo = 0). Dashed line: (B) is a priori more probable than A (Lo = −0.6). Dotted line: (A) is a priori more probable than B (Lo = 0.6). (B) Same as is (A), for the diffusion model. (C) Mean reaction time as a function of motion coherence for the simplified Bayesian model. Plain line: correct trial. Dashed line: error trials. (D) Same as in (C) for the diffusion model. (E) Reaction time distribution for low coherence trials (c = 0.05). The frequency was estimated by counting the number of RT observed over 20000 decision trials. Blue: Bayesian model. Red: diffusion model. Plain: correct trials. Dashed: error trials. Error trials are presented upside down for clarity. (F) Same as in (E) for high coherence trials (c = 0.3).

