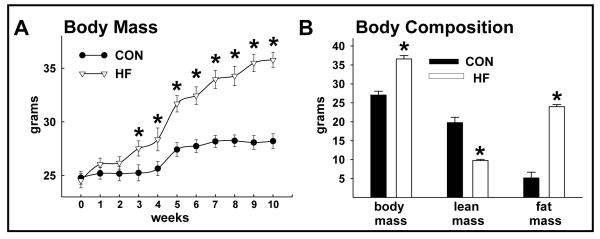
FIGURE 1.
Body mass and composition of random-fed CON and HF mice. Body mass was greater (*p<0.05) in HF vs. CON mice after 3 weeks of feeding (A). Body mass and fat mass were greater and lean mass was less in HF vs. CON mice (all p<0.05; B). Values represent mean ± standard error of the mean (SEM).

