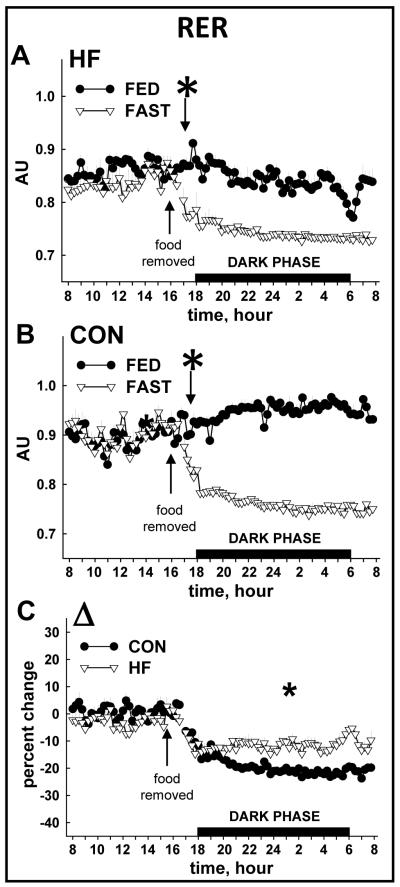
FIGURE 6.
Respiratory exchange ratio (RER) from CON and HF mice during the FED and FAST conditions. The tempo of fasting-induced reduction of RER was not different between HF and CON mice (A, B). Noting the lower baseline (i.e., FED) RER in HF vs. CON mice (A, B), it is not surprising that the overall fasting-induced percent change (Δ) in RER observed from 1600-0800 h on day 3 was greater in CON vs. HF mice. FED values represent mean data from 2 × 24 h periods (i.e., days 1-2); FAST values represent 1 × 24 period (i.e., day 3) that contains a fasting segment from ~1600 to ~0800. The “*” indicates the time at which a sustained statistical difference between FED and FAST values was first observed. Values represent mean ± SEM.

