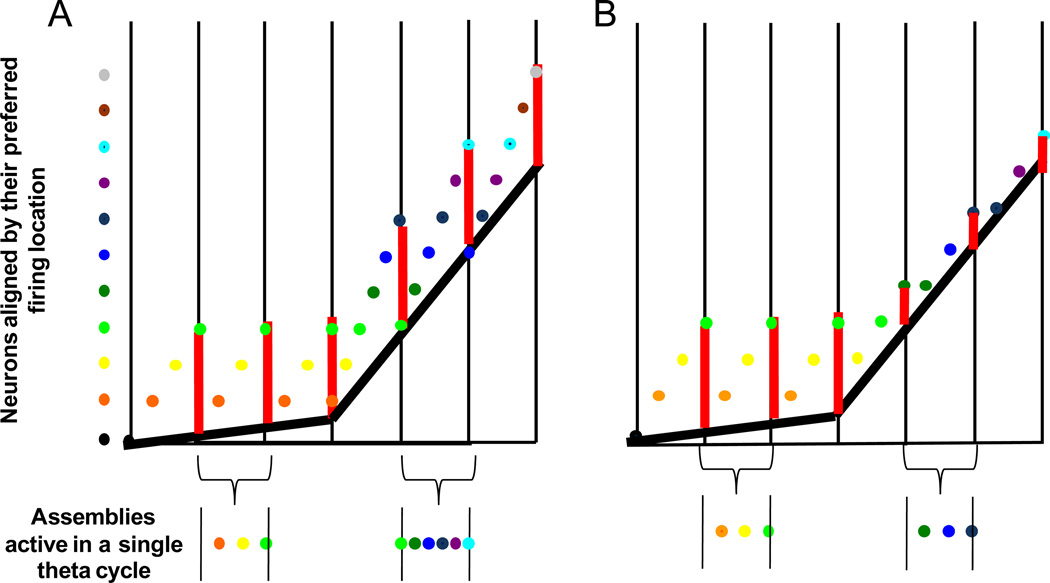
Figure 1.
A schematic of the ‘look ahead’ of CA1 cell assembles when there is an increase sequence compression of active cell assemblies at faster running velocities (A) and when the number of assemblies is constant (B). The Y dimension is spatial location and the X dimension is time in theta cycles. The vertical back lines delineate different theta cycles and the dots on the left represent different CA1 cell assemblies sorted by the location of their place fields. For example, the black cell assembly is active before the orange cell assembly, which is active before the yellow and so on. The current position of the rat is indicated by the thick black line. Notice that at faster velocities, this line has a steeper slope. Finally, the vertical red lines represent the size of place fields (and “jump-back”, Tsodyks et al., 1996). In A, at slower velocities only three cell assemblies (orange, yellow, green) are active within a theta cycle. At faster velocities, for place field size to be maintained, six cell assemblies (green, dark green, blue, dark blue, purple, cyan) need to be active within a theta cycle for the distance between the rat’s current location and the position of the hippocampal network to remain constant with increases in running speed. This results in an increase in sequence compression (i.e., the temporal offset between cell assemblies decreases as running speed increases). In B, when there is no increase in sequence compression, three cell assemblies are active within a theta cycle regardless of the rat’s velocity. In this case, the jump-back is smaller at higher running velocities. Therefore, the result of no increase in change in the composition of the phase sequence is a decrease in place field size at higher velocities, which is not observed empirically (see Supplemental Figure 1).

