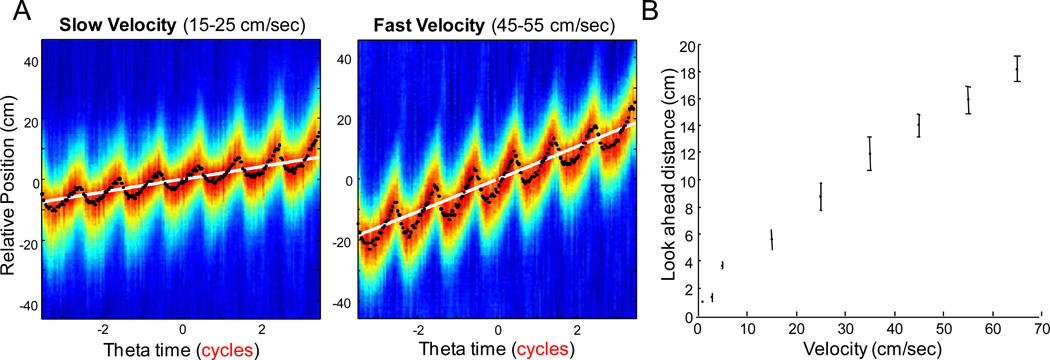
Figure 2.
(A) Average time by space correlations for two representative dorsal hippocampal CA1 datasets. The top row shows the low velocity bin of 15–25 cm/sec and the bottom row shows data from the 45–55 cm/sec velocity bin. The colors represent the average correlation values for that specific phase and relative location. The color axis is not maintained across plots, but optimized for visual inspection. The black dots are the relative spatial location of highest correlation for each theta bin, while the white line is the rats’ average relative position for each theta bin. Note that the look-ahead phenomenon is low at low velocities but is larger at higher velocities. (B) Shows the distance of the CA1 look ahead as a function of velocity. The increase in the distance of the look ahead at higher running speeds suggest that more cell assemblies are active within a theta cycle at higher velocities, that is, the phase sequence becomes larger.

