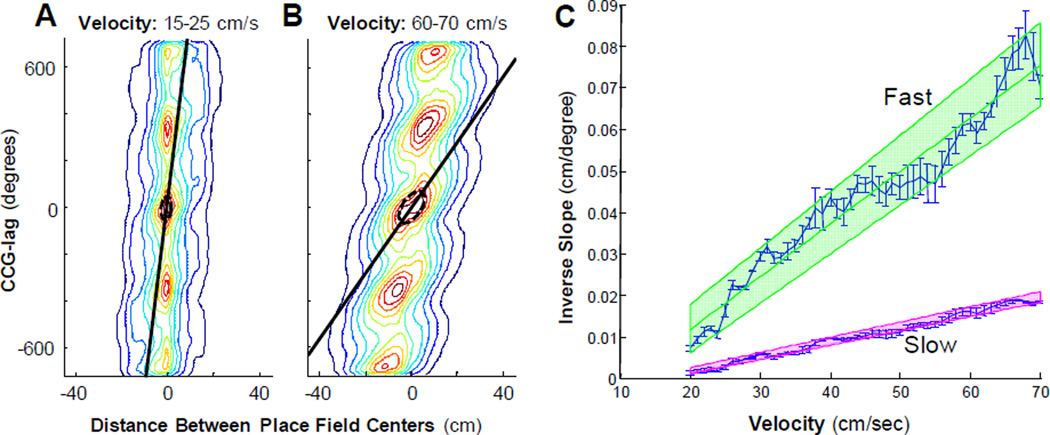
Figure 3.
The rate of cell assembly transition plotted at different velocities. The contour plots (panels A and B) show the relationship between the CCG lag versus distance between place fields (compare to Figure 2A of Dragoi and Buzsaki, 2006). The ‘fast’ slope of the CCG lag plotted as a function of the distance between field centers (black line) was determined by using a covariance ellipsoid fit of the central contours (see Methods). Note that the fast slope is nearly vertical at lower velocities (slope = 100 deg/cm; inverse slope = 0.01 cm/deg) and becomes more shallow at higher velocities (slope = 14.29 deg/cm; inverse slope = 0.07 cm/deg). Panel C shows the inverse of both the fast and ‘slow’ slope (see methods) as a function of velocity. The green line and shaded region shows the line of best fit and the 95% confidence interval for the fast slope while the pink line and shaded region shows the line of best fit and 95% confidence interval for the slow slope. There is an evident relationship between the fast slope and velocity indicating that the rate of cell assembly transition increases with higher running speeds.

