Figure 1.
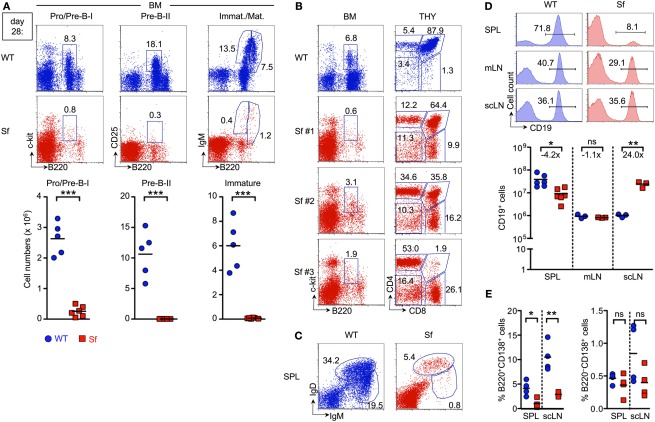
Severe B and T lymphopoietic defects in adolescent Sf mice. B cell compartments in the BM and peripheral lymphoid organs of 4-week-old Sf mice and WT littermate control animals were analyzed by flow cytometry. T cell development in the thymus was concomitantly assessed. (A) Flow cytometry of B220+c-kit+ Pro/Pre-B-I (left), B220+CD25+ Pre-B-II (middle), as well as immature B220lowsIgM+, and mature/recirculating B220highsIgM+ B cells (right) from BM of WT (top) and Sf (bottom) mice. Graphs depict absolute numbers of respective B cell developmental compartments in WT (blue circles) and Sf (red squares) mice, as indicated. (B) Correlation of severely reduced Pro/Pre-B-I cell compartments in the BM (left) of individual Sf mice (Sf #1–3) with T lymphopoietic activity (right) in the thymus (THY). (C,D) Analysis of peripheral B cell compartments. (C) Flow cytometry of newly formed IgDlowIgMhigh and mature IgDhighIgMlow B cells in the spleen. (D) Percentages (histograms) and numbers (graphs) of CD19+ B cells in spleen (SPL), mLNs, and scLNs. Numbers in dot plots and histograms indicate the percentage of gated cells within the respective gates. (E) Percentages of CD138+ plasma cells among B220+ (left) and B220− (right) B cells in peripheral lymphoid tissues of 4-week-old Sf and WT mice, as indicated. Dots and horizontal lines in graphs indicate individual mice and mean values, respectively, and numbers indicate the fold difference in cell numbers observed in WT (blue circles) and Sf (red squares) mice. Data are representative of at least two independent experiments using three to six mice per group. (Student’s t test: ***p ≤ 0.001; **p ≤ 0.01; *p ≤ 0.05; ns: not significant).

