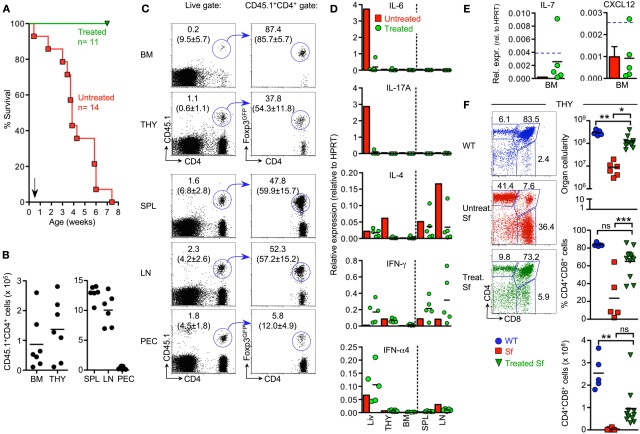
Figure 5.
Adoptive Treg cell transfer in Sf mice. (A) Kaplan-Meier survival curves of CD45.2 Sf mice that had either been left untreated (red squares; n = 14) or injected with total populations of CD4+ T cells from Foxp3-proficient CD45.1+ Foxp3GFP mice (green triangles; n = 11), as indicated by the arrow. 6–8 weeks after cell transfer, recipient Sf mice were subjected to analysis by flow cytometry and RT-PCR. Data were collected from 2 (B,C) or 3 (F) independent experiments. (B,C) Congenically marked T cells were tracked in primary and secondary lymphoid organs of recipient mice. (B) Absolute numbers and (C) flow cytometry of CD4+CD45.1+ cells (left) for Foxp3GFP expression among gated CD4+CD45.1+ cells (right) in indicated organs. Lines with arrowheads illustrate the gating scheme. Dots and horizontal lines in graphs indicate individual mice and mean values, respectively. Numbers in dot plots without parentheses indicate the percentage of gated cells within the respective gates. Parenthesized numbers indicate mean percentages ± SD of CD45.1+ cells among gated CD4+ cells (left) or mean percentages ± SD of Foxp3+ cells among gated CD4+CD45.1+ cells (right). (D,E) Impact of adoptive Treg cell transfer on in situ production of cytokines. The expression of mRNAs encoding (D) indicated inflammatory cytokines and (E) IL-7 and CXCL12 was assessed by quantitative RT-PCR employing total RNA extracted from indicated whole tissues of Sf mice that had previously been injected with Treg cells. Each dot represents an individual Sf recipient mouse, and horizontal bars indicate mean values. Bars depict mean values from pooled single cell suspensions of three individual untreated 4-week-old Sf mice. Blue hatched lines indicate mRNA expression levels in WT animals for comparison (see also Figures 2F,G). HPRT was used for normalization. Data are representative of at least three independent experiments. (F) Impact of adoptive Treg cell transfer on T cell development in the thymus of Sf mice. Representative flow cytometry of CD4 and CD8 expression on thymocytes from WT mice (6-week-old; top) and Sf mice that were either left untreated (4-week-old; middle) or treated with adoptive Treg cell transfer (6–8-week-old; bottom). Numbers in dot plots indicate the percentages of gated cells within the respective gates. Graphs depict total thymic cellularity (top), as well as percentages (middle) and numbers (bottom) of DP thymocytes of WT mice (blue circles), as well as Sf mice that were either left untreated (red squares) or treated with adoptive Treg cell transfer (green triangles). Symbols and horizontal lines in graphs indicate individual mice and mean values, respectively. (One-way ANOVA: ***p ≤ 0.01; **p ≤ 0.01; *p ≤ 0.05; ns, not significant).

