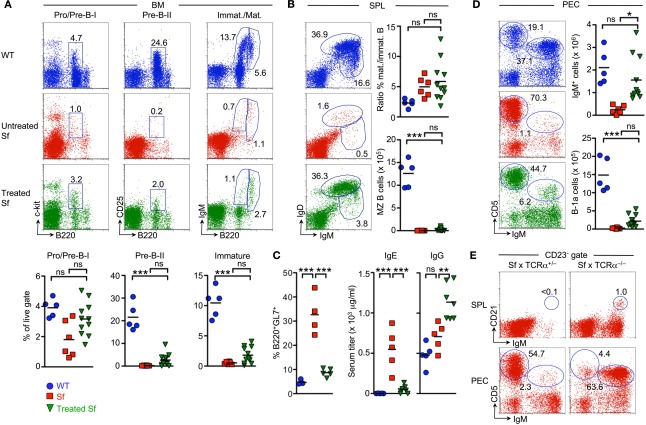
Figure 6.
Impact of adoptive Treg cell transfer on B cell development in Sf mice. Central and peripheral B cell compartments were analyzed in cohorts of experimental mice described in Figure 5. (A) B cell development in the BM. Representative flow cytometry of B220+c-kit+ Pro/Pre-B-I (left), B220+CD25+ Pre-B-II (middle), as well as immature B220lowsIgM+ and mature/recirculating B220highsIgM+ (right) cells from BM of WT (top) and Sf mice that were either left untreated (middle) or treated with adoptive Foxp3+ Treg cell transfer (bottom). Graphs depict percentages of respective B cell developmental compartments from WT (blue circles), as well as untreated (red squares) and treated Sf (green triangles) mice. (B) B cell compartments in the spleen. Representative dot plots of newly formed IgDlowIgMhigh and mature IgDhighIgMlow B cells in mice as in (A), and graphs depicting the ratio of mature and newly formed B cells (top) and absolute numbers of IgMhighIgDlow CD23low/−CD21high MZ B cells (bottom). (C) Percentages of LN-derived B220+ cells expressing the activation/germinal center B cell marker GL7, as revealed by flow cytometry (left), and quantification of IgE and total IgG levels (μg/ml) in serum (middle and right) from WT (blue circles) and untreated Sf (red squares) mice (both 4-week-old), as well as treated Sf (green triangles) mice (>4–7-month-old). (D) Representative flow cytometry of IgM and CD5 expression among PECs from mice as in (A), and graphs depicting absolute numbers of total IgM+ cells (top) and IgMhighCD5+ B-1a cells (bottom). (E) Representative flow cytometry of IgMhighCD21high MZ B cells among gated IgDlowCD23low/− splenocytes (left) and peritoneal IgMhighCD5+ B-1a cells (right) in four-week-old Sf × TCRα+/− and Sf × TCRα−/− mice, as indicated. Numbers in dot plots indicate the percentage of gated cells within the respective gates. Dots and horizontal lines in graphs indicate individual mice and mean values, respectively. For experimental details see also legend to Figure 5. (One-way ANOVA: ***p ≤ 0.001; *p ≤ 0.05; ns, not significant).

