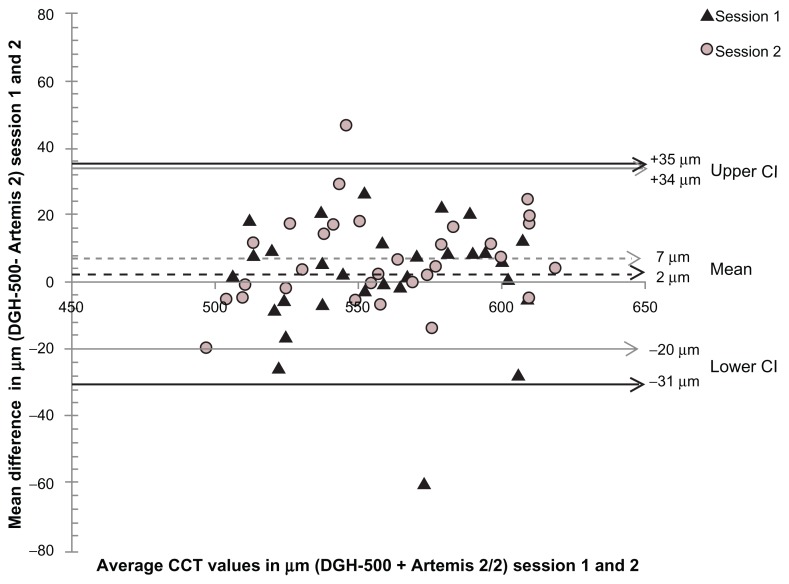
Figure 2.
Bland-Altman plot of mean difference in central corneal thickness measurements between ultrasound pachymetry and Artemis-2 against their mean in session 1 and session 2.
Notes: Mean difference in session 1, P > 0.05; session 2, P > 0.05.
Abbreviations: CCT, central corneal thickness; CI, confidence interval.

