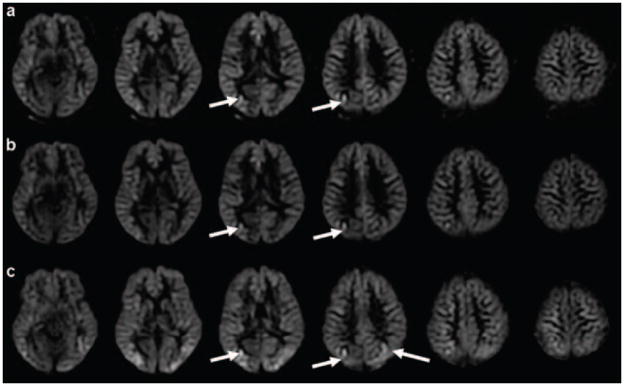
Figure 7.
The images without vessel suppression obtained with the optimal delay (the post-labeling delay calculated from multiple delay prescan): (a) subtraction images from control and label pairs; (b) perfusion images with the standard quantification; (c) perfusion images with transit delay correction. The bright vessel signals (pointed by arrows) can be seen both in the difference image and the quantified perfusion images.

