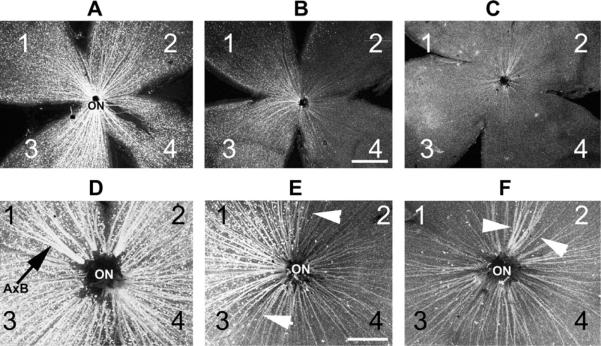
Fig. 16.
rAION-induced RGC loss in a Thy1-CFP transgenic mouse line. Each retina is divided into quadrants (1–4). A. Control retina. CFP(+) RGCs form a `starry sky' pattern against the flattened retina, with CFP(+) axons projecting toward the optic nerve (ON). B. retina 30 days post-rAION induction (12 s). Regional CFP(+) RGC loss is apparent in quadrant 2. Overall, this animal had a 30% Thy-1 (CFP) RGC loss, determined by quantitative stereology. C. Retina 30 days post-rAION induction (12 s). There is fairly diffuse 85% RGC loss. Panels D–F: Magnified views of panels A–C showing in more detail the RGC axon patterns seen in panels A–C. D. Asymmetric axon bundles (A×B) are visible in the control retina as axons approach the ON. E. Axon pattern of retina shown in panel B. There is a regional preservation of axon bundles (indicated by the arrowheads), with decreased density elsewhere. F. Axon pattern of retina shown in panel C. There is a diffuse loss of axons, with a single large preserved axon bundle indicated by arrowheads. Scale bar: 500 microns.

