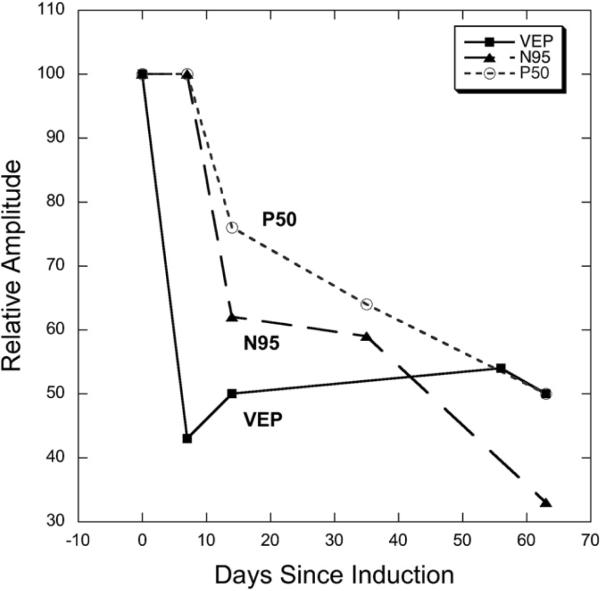
Fig. 20.
VEP and pERG results from NHP Q11. Relative amplitude (experimental eye/control eye) is plotted as a function of time. The VEP amplitude is affected first, and in this animal, shows a 50–60% loss compared to the fellow, control eye. VEP loss did not continue to worsen, nor did it appreciably recover. Between 1 and 2 weeks post-induction, the pERG amplitude began to decrease, with the N95 component showing a larger reduction than the P50 component. This finding may indicate a longer time window for partial treatment of NAION.

