Fig. 5.
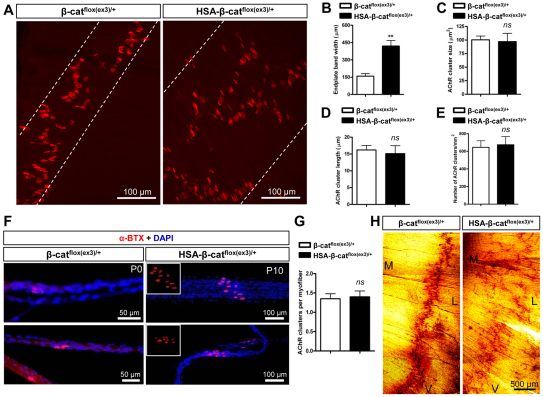
Postsynaptic deficits of HSA-β-catflox(ex3)/+ NMJs. (A) P0, left hemi-diaphragms were stained for AChR. White dashed lines were drawn to include most AChR clusters. (B) Increased endplate band width in HSA-β-catflox(ex3)/+ diaphragms (**P<0.01, n=6, t-test). (C-F) No change in AChR cluster size (C), length (D) or density (E) in HSA-β-catflox(ex3)/+ diaphragms (P>0.05, n≥5, t-test). (F) Individual muscle fibers with AChR clusters (red). Nuclei were stained with DAPI (blue). (G) Quantitative analysis of data shown in F (P>0.05, n=22, t-test). (H) Scattered AChE clusters in HSA-β-catflox(ex3)/+ diaphragms (P0). V, ventral; L, lateral; M, medial. Error bars indicate s.e.m.

