Fig. 7.
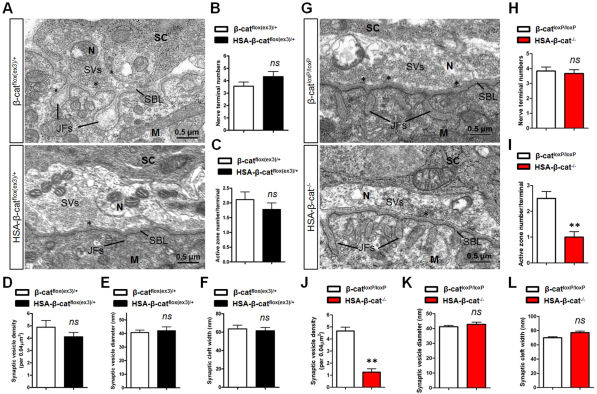
Reduced number of synaptic vesicles and active zones in muscle β-catenin LOF, but not GOF, NMJs. (A) Representative electron micrographic images of NMJs in β-catflox(ex3)/+ control (upper panel) and HSA-β-catflox(ex3)/+ (lower panel) mice. N, nerve terminal; M, muscle fiber; SC, Schwann cell; SVs, synaptic vesicles; SBL, synaptic basal lamina; JFs, junctional folds; Asterisks mark active zones. (B-F) Quantitative analysis showed no difference in nerve terminal numbers (B), active zone numbers per nerve terminal (C), synaptic vesicle density (D), synaptic vesicle diameter (E) or synaptic cleft width (F) (P>0.05, n=10, t-test). (G) Representative electron micrographic images of NMJs in β-catloxP/loxP control (upper panel) and HSA-β-cat–/– (lower panel) mice. (H-L) Quantitative data are shown for nerve terminal numbers (H), synaptic vesicle diameter (K), synaptic cleft width (L), active zone numbers per nerve terminal (I) and synaptic vesicle density (J) (**P<0.01, n=10, t-test). Error bars indicate s.e.m.

