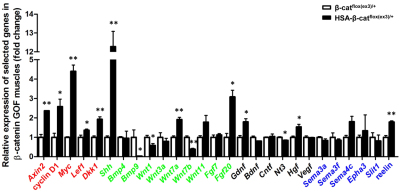
Fig. 8.
Different gene expression in HSA-β-catflox(ex3)/+ muscles. Total RNA was isolated and subjected to quantitative real-time PCR for indicated genes. mRNA levels were calibrated to Gapdh mRNA levels and normalized to mRNAs from control mice (**P<0.01, *P<0.05, n=3, t-test). Known Wnt/β-catenin target genes are shown in red; morphogens in green; neurotrophic factors in black; and axon guidance molecules in blue. Error bars indicate s.e.m.

