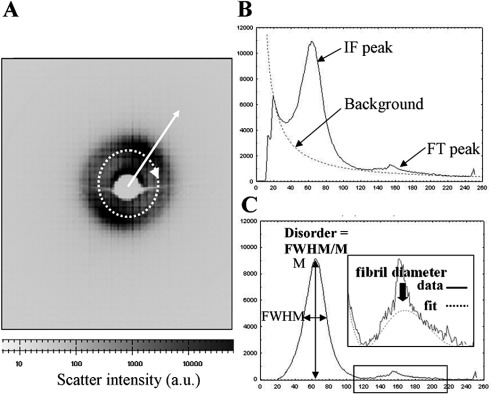
Figure 2.
(A) SAXS pattern from mouse cornea. The collagen interference function peak is visible. A circular integration (dotted arrow) was performed and the resulting integrated intensity extracted in the radial direction (solid arrow). (B) Resulting intensity distribution. A background scatter function was fitted to extract the collagen interference function (IF) and fibril transform (FT) peaks. (C) The shape and position of the IF and FT peaks were used to determine the relative amount of collagen matrix disorder and the average collagen fibril diameter, respectively. The sharp third-order peak from the collagen 65-nm axial period17 is also visible superimposed on the FT peak in (B) and (C) and may be ignored in the data analysis.

