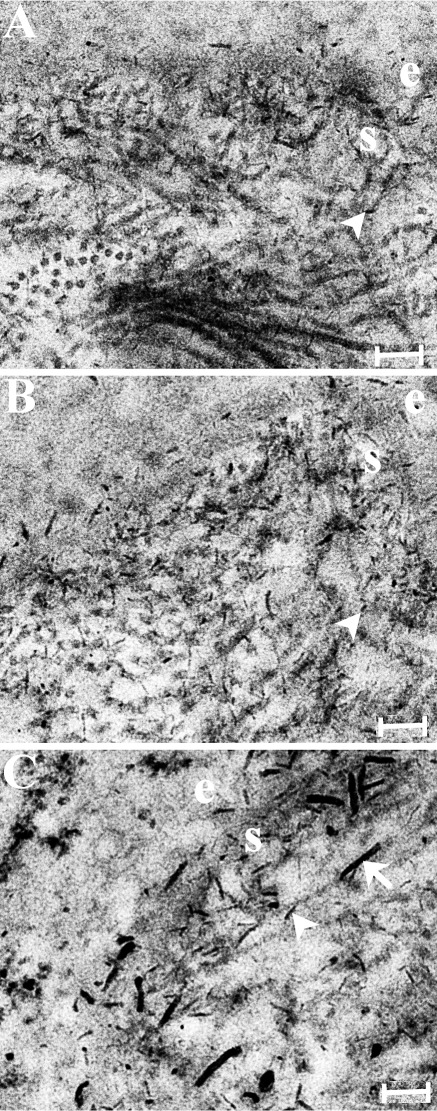
Figure 9.
Transmission electron microscopy with cuprolinic blue staining for the three experimental groups: (A) uninjured control, (B) epithelial debridement only, (C) epithelial debridement with basement membrane disruption. Proteoglycan–dye complexes are visible as thin, electron-dense filaments (arrowheads). Corneas in which the basement membrane was disrupted displayed additional longer, thicker filaments in the subepithelial stroma (C, arrow). e, epithelium; s, stroma. Scale bar: 200 μm.

