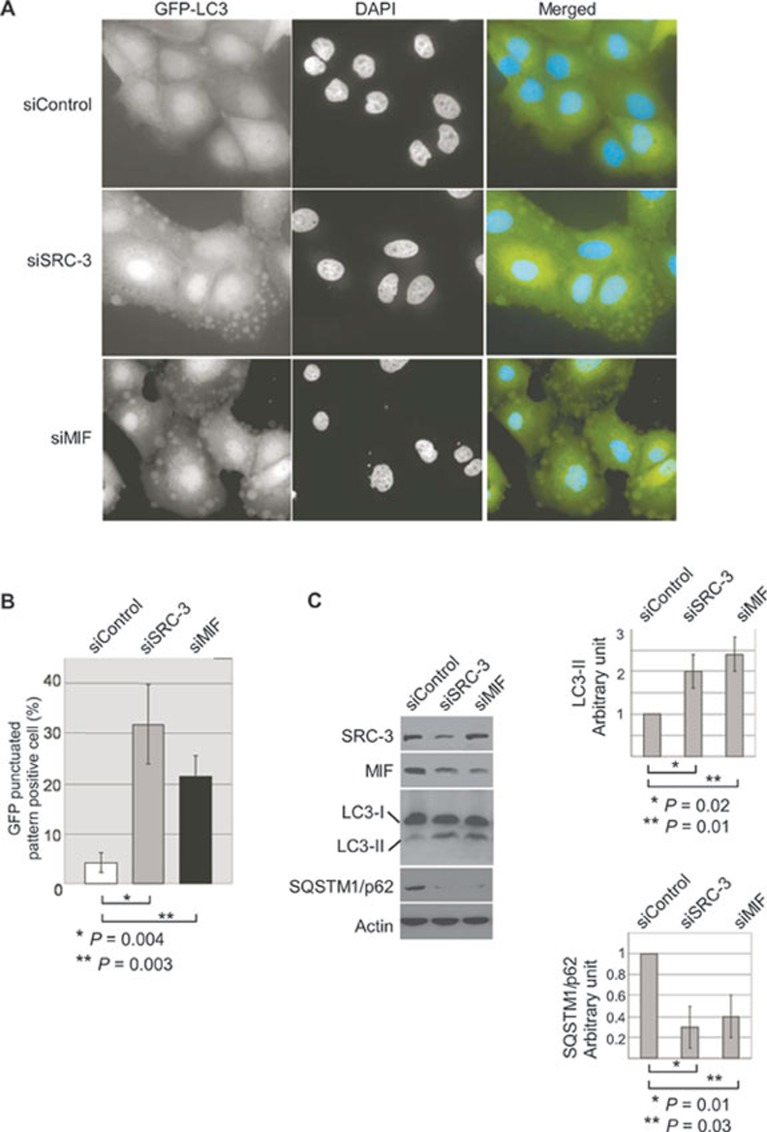
Figure 5.
SRC-3 and MIF regulate autophagy. (A) Induction of autophagy in SRC-3 or MIF knockdown MCF-7 cells was visualized by the formation of punctated GFP-LC3 structure. MCF-7 cells that stably expressed the GFP-LC3 fusion were transfected with either control siRNA or siRNAs specific for SRC-3 or MIF. The cells were imaged 36 h after transfection. (B) Quantification of autophagy represented the ratio of GFP-LC3 punctate-positive cells to the total cells counted. More than 300 cells per group were counted in each experiment and the results were from three independent experiments. (C) Cell lysates from MCF-7 transfected with control siRNA or siRNAs specific against SRC-3 (siSRC-3) or MIF (siMIF) were analyzed with antibodies against LC3 or SQSTM1/p62 to determine the autophagy activity. Knockdown of SRC-3 or MIF was confirmed with specific antibodies. β-actin was used as loading controls. Normalized intensity is quantified by ImageJ. Graph shows quantification data in arbitrary units for the density of the LC3-II (top right) or SQSTM1/p62 (bottom right) bands from each sample. Columns and bars represent the mean ± SD of the results from three independent experiments. Difference is considered significant at the 95% confidence level.

