Figure 6.
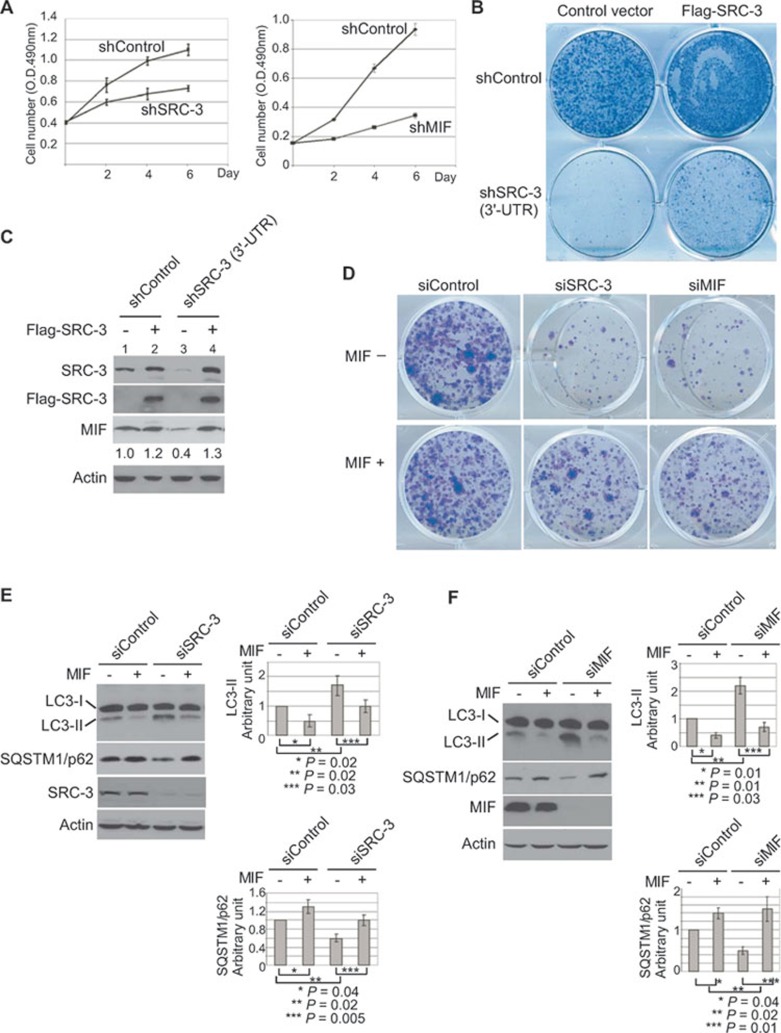
MIF regulates cell viability through autophagy. (A) Proliferation of MCF-7 cells after knockdown of SRC-3 (shSRC-3) or MIF (shMIF) was compared to the control cells (shControl). The cell numbers at 2, 4 and 6 days after plating were measured by MTT assay. The values represent means ± SD from three experiments. (B) The viability of the cells transfected with control vector or SRC-3 expression construct after knockdown of SRC-3 by shRNA targeting the 3′-UTR of SRC-3 was determined by colony-formation assay. (C) The expression of transfected Flag-SRC-3 and endogenous MIF from experiments described in B was determined by immunoblot analysis in a parallel experiment. β-actin was used as loading controls. (D) The viability of MCF-7 cells after knockdown of SRC-3 or MIF was determined by colony-formation assays. The medium was changed every 2 days. For treatment with MIF, MIF (50 ng/ml) was added to the medium every time the medium was changed. The colonies were then fixed and stained with 0.5% crystal violet. Shown is a representative from three experiments with similar results. (E) MCF-7 cells were transfected with control (siControl) or siRNA specific for SRC-3 (siSRC-3). After 48 h of transfection, the cells were treated with MIF (50 ng/ml) for an additional 4 h when indicated. Cell lysates were analyzed using the indicated antibody. β-actin was used as loading controls. (F) MCF-7 cells were transfected with control (siControl) or siRNA specific for MIF (siMIF), and treated as in C. Cell lysates were analyzed by immunoblot using the indicated antibody. β-actin was used as loading controls. All normalized intensity is quantified by ImageJ. Graph shows quantification data in arbitrary units for the density of the LC3-II or SQSTM1/p62 bands from each sample. Columns and bars represent the mean ± SD of the results from three independent experiments. Difference is considered significant at the 95% confidence level.

