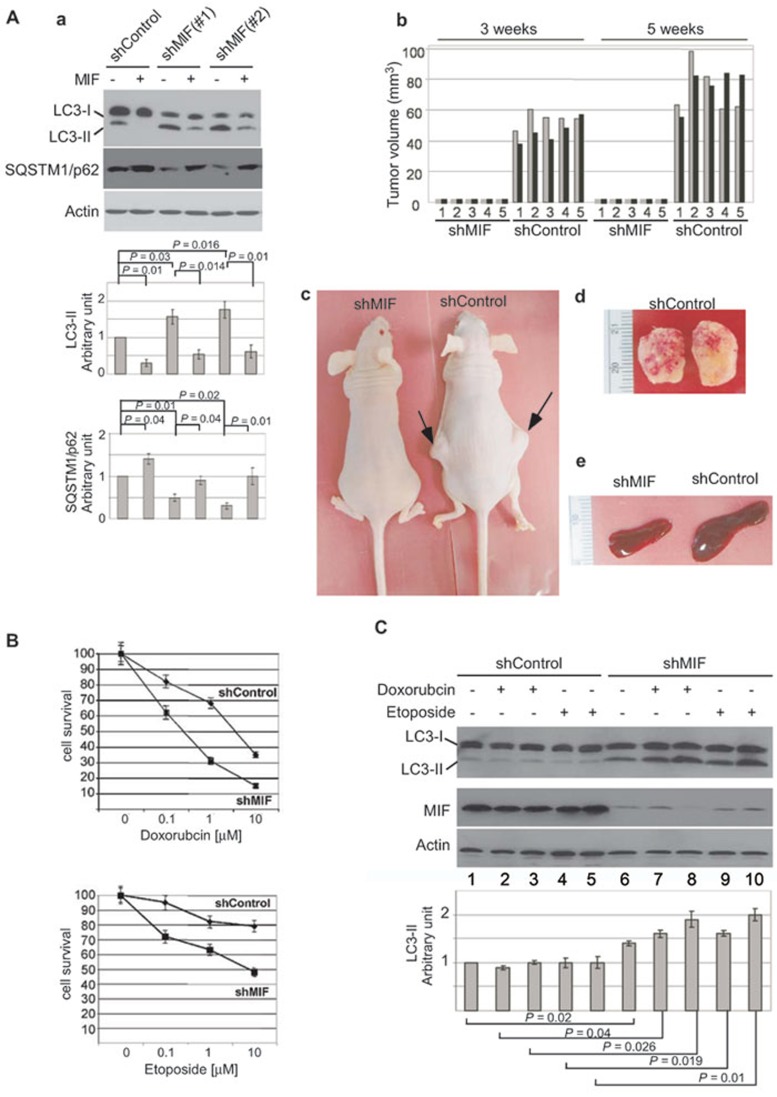
Figure 7.
Downregulation of MIF suppressed tumorigenicity and enhanced chemosensitivity in MCF-7 breast cancer cells. (A) a. Expression of autophagy-specific LC3-II and SQSTM1/p62 in stable MIF knockdown cells was determined. When indicated, cells were treated with MIF (50 ng/ml) for 4 h before harvest. Normalized intensity is quantified by ImageJ. b. Comparison of tumor volumes from mice injected with shControl or shMIF cells measured at 3 and 5 weeks after injection. Gray and black bars represent tumor sizes from the two injected sides. c. A representative image of the mice at week 5 post-injection. d. Tumors taken from the siControl cells-injected mice (panel d). e. A representative image showed the spleen from the siControl cells injected mice was enlarged. (B) Stable MIF knockdown MCF-7 cells were treated with 0.1, 1 and 10 μM of doxorubicin or etoposide for 18 h, and the cell viability was determined by MTT assay. Shown is mean ± SD from three experiments performed in triplicate. (C) Stable MIF knockdown MCF-7 cells were treated with low concentrations (0.1 and 1 μM) of doxorubicin or etoposide. The levels of autophagy-specific LC3-II were determined. Knockdown of MIF was confirmed. β-actin was used as loading controls. Normalized intensity is quantified by ImageJ. Graph shows quantification data in arbitrary units for the density of the LC3-II or SQSTM1/p62 bands from each sample. Columns and bars represent the mean ± SD of the results from three independent experiments. Difference is considered significant at the 95% confidence level.

