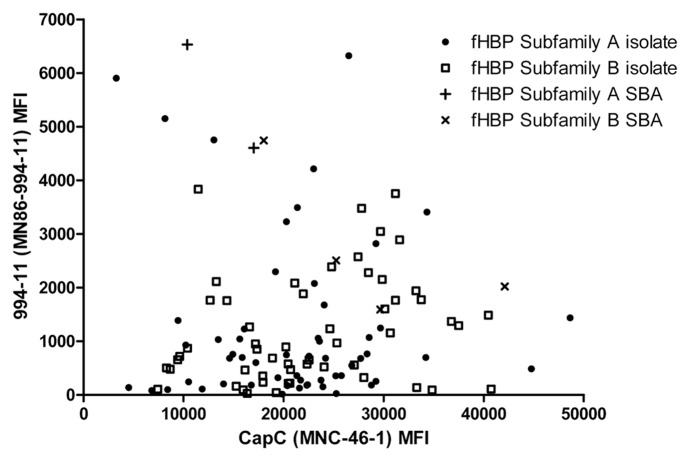
Figure 5.
Serogroup C capsular polysaccharide and fHBP expression levels on serogroup C isolates. Serogroup C capsular polysaccharide and fHBP expression levels on the 116 serogroup C isolates were analyzed by flow cytometry. The serogroup C capsular polysaccharide MFI values are shown on the X-axis and the fHBP MFI values on the Y-axis. fHBP subfamily A isolates are represented by filled circles or crosses (+) if tested in the SBA. fHBP subfamily B isolates are represented by open squares or x if tested in the SBA.

