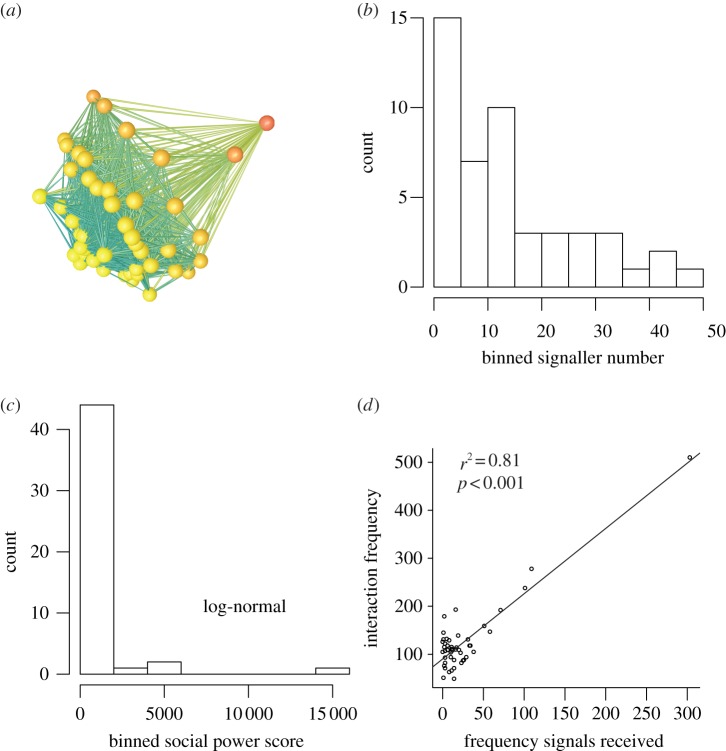
Figure 1.
(a) Subordination signalling network. Nodes are individuals and are coloured by frequency of signals received (orange node receives largest number of signals). (b) Frequency distribution of number of signallers to a given receiver (unweighted in-degree distribution of signaller number). (c) Frequency distribution of social power, where power is computed for individual i by multiplying i's total number of signals received by its number of signallers (§6). (d) Relationship between signals received and interaction frequency (operationalized as signals received plus signals emitted plus fights participated in).

