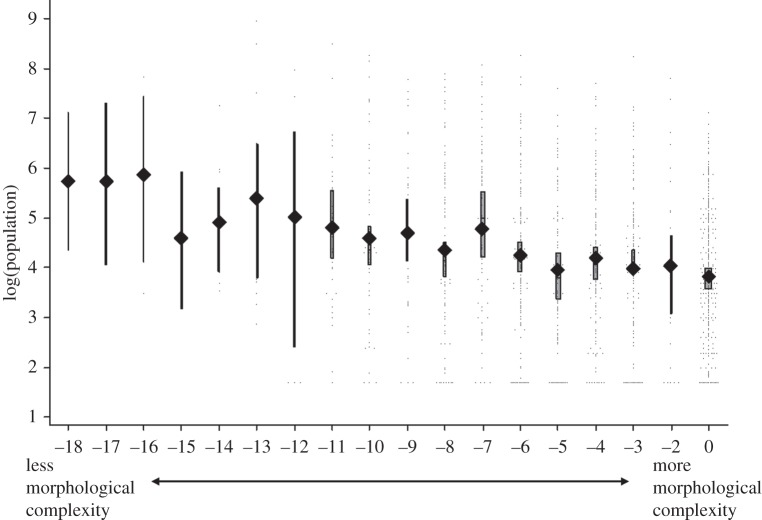
Figure 2.
Mean speaker population sizes for languages of different degrees of morphological complexity. Bars represent 95% CI of the median, and their width is proportional to the sample size for that degree of complexity. Reproduced from Lupyan & Dale [31].

