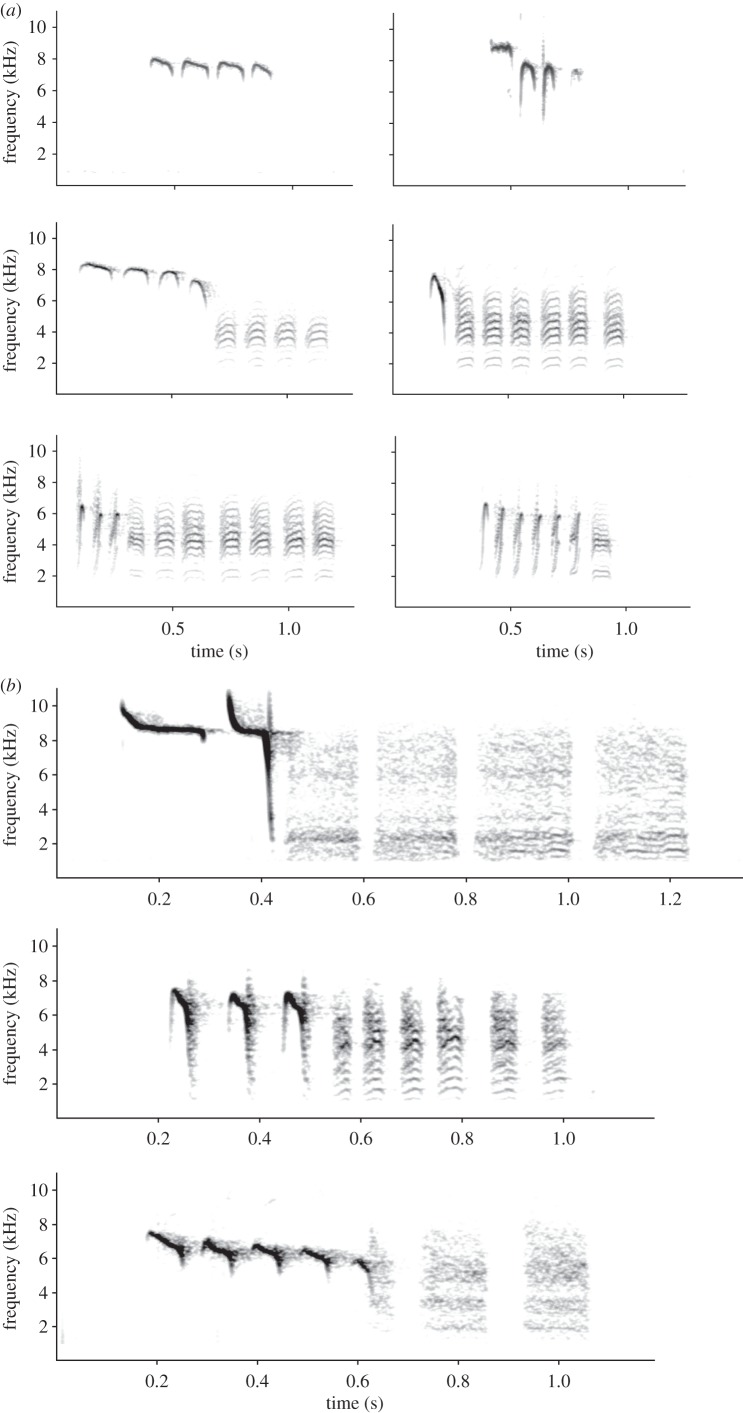
Figure 1.
(a) Spectrograms of chick-a-dee calls of Carolina chickadees, Poecile carolinensis. (b) Spectrograms of chick-a-dee calls of three titmouse species: top, tufted titmouse, Beaolophus bicolor; middle, bridled titmouse, B. wollweberi; bottom, oak titmouse, B. inornatus. In each spectrogram, the y-axis represents frequency (0–11 kHz) and the x-axis represents time (seconds). Spectrograms were generated using Avisoft SASLab Pro (Raymund Specht, Berlin, Germany), with a fast Fourier transform (FFT) of 512, frame 100%, Blackman window function and resolution 43 Hz.

