
Figure 2.
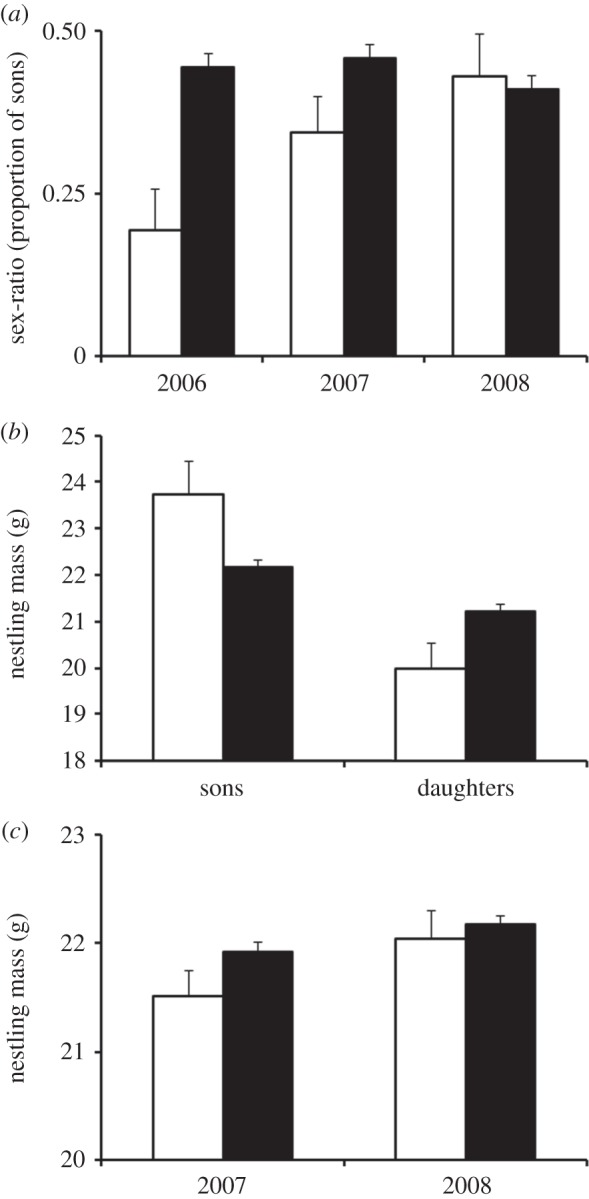
Variations in (a) brood sex-ratio and nestling mass at day 12 (mean ± s.e.) according to (b) nestling sex and maternal age in 2006 and (c) maternal age in 2007 and 2008. Second-year females are represented by white bars and after second-year by black bars.